 |
Dynodroid Evaluation Data |
|
|
We compared the performance of Dynodroid on 50 Android apps with the following two state-of-the-art approaches:
- The Monkey fuzz testing tool provided in the Android platform; and
- Manual testing conducted in a user study involving ten expert users.
This page describes the data that was used in and produced by the above evaluation.
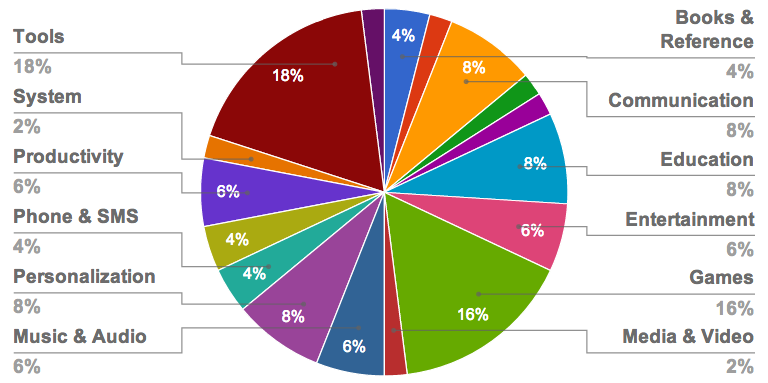
We randomly chose the 50 apps in our study from the Android open-source apps repository F-Droid. Their distribution by category is as below:
We evaluated five input generation approaches on the 50 apps:
- Dynodroid using each of three different event selection strategies (Frequency, UniformRandom, BiasedRandom);
- The Monkey fuzz testing tool provided in the Android platform; and
- Manual testing conducted in a user study involving ten expert users.
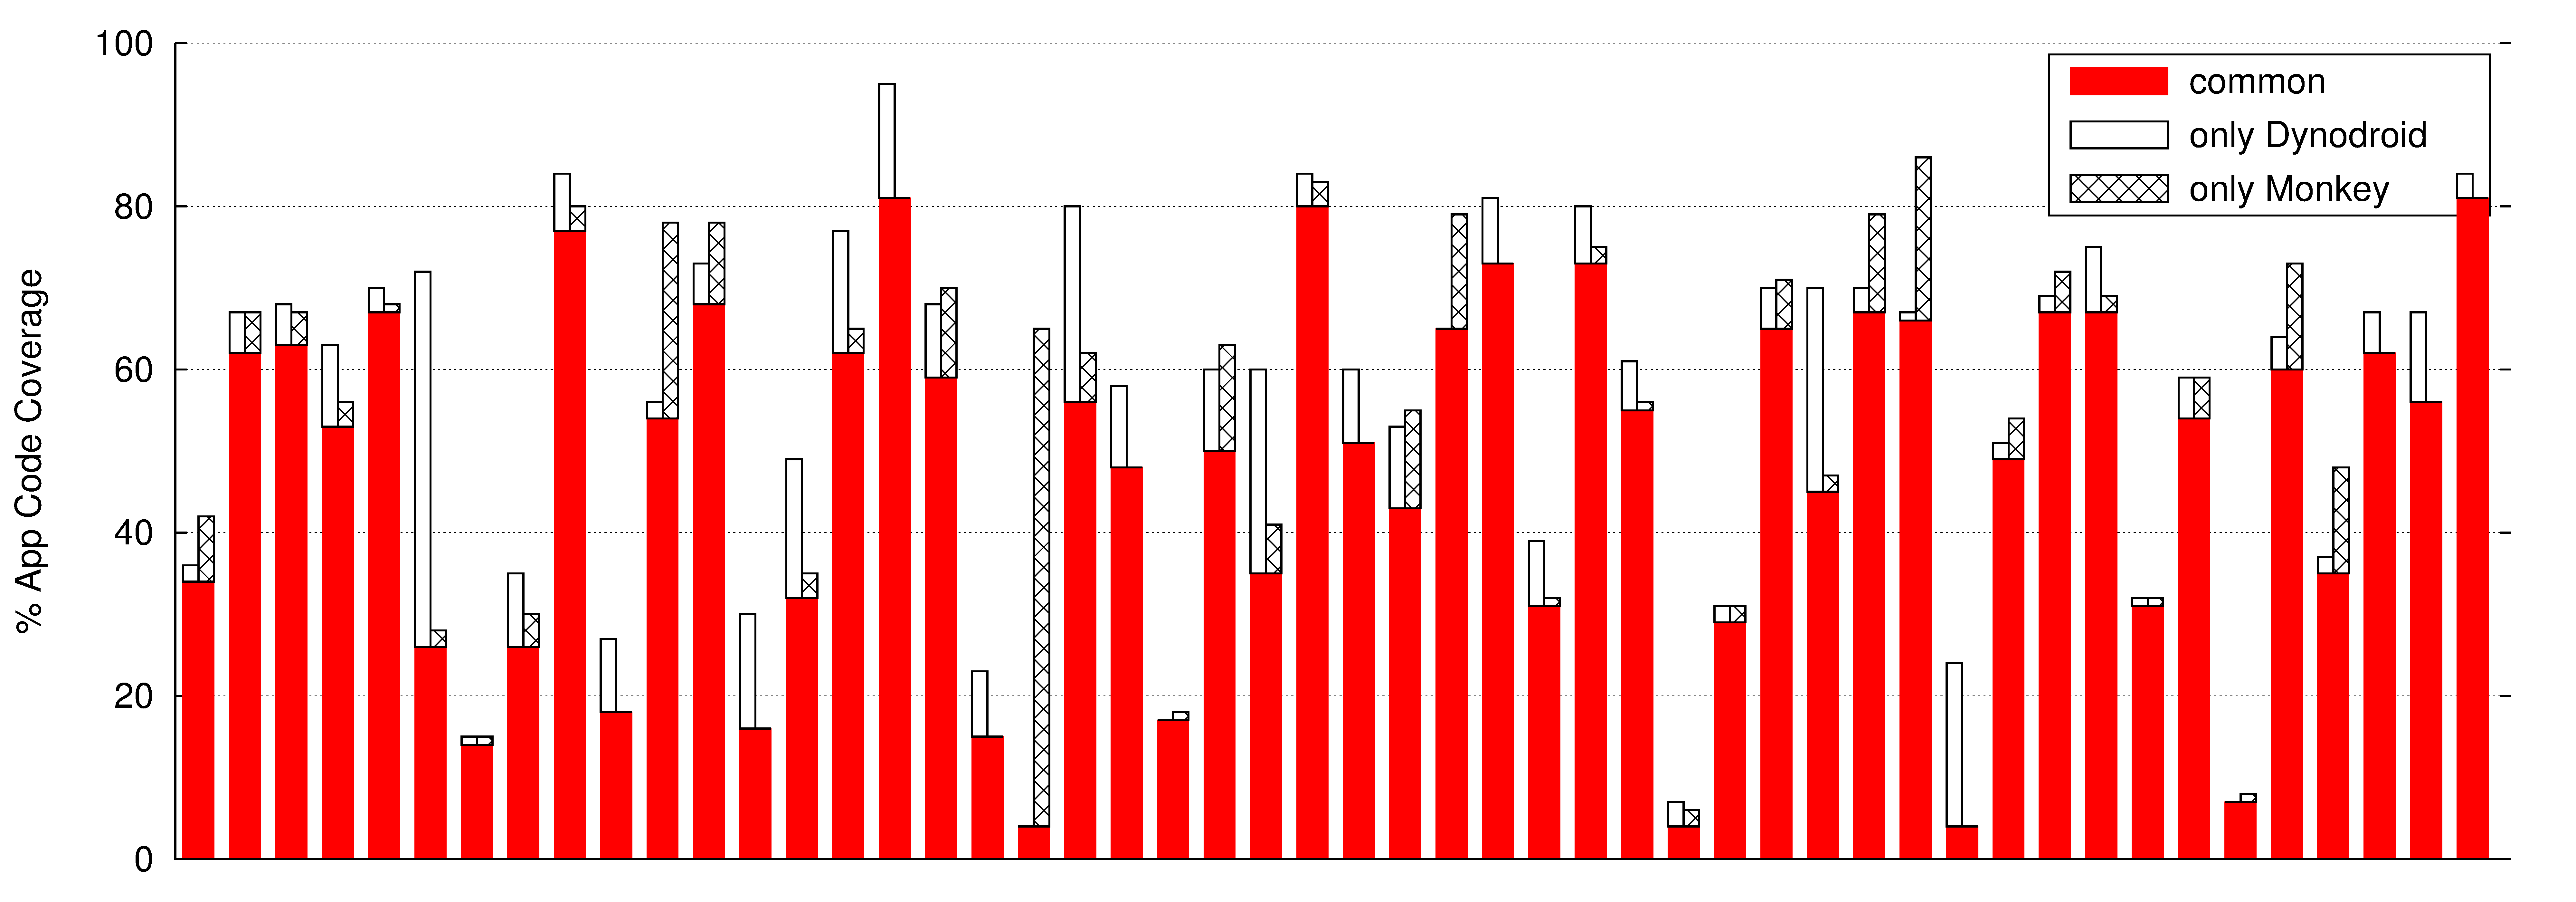
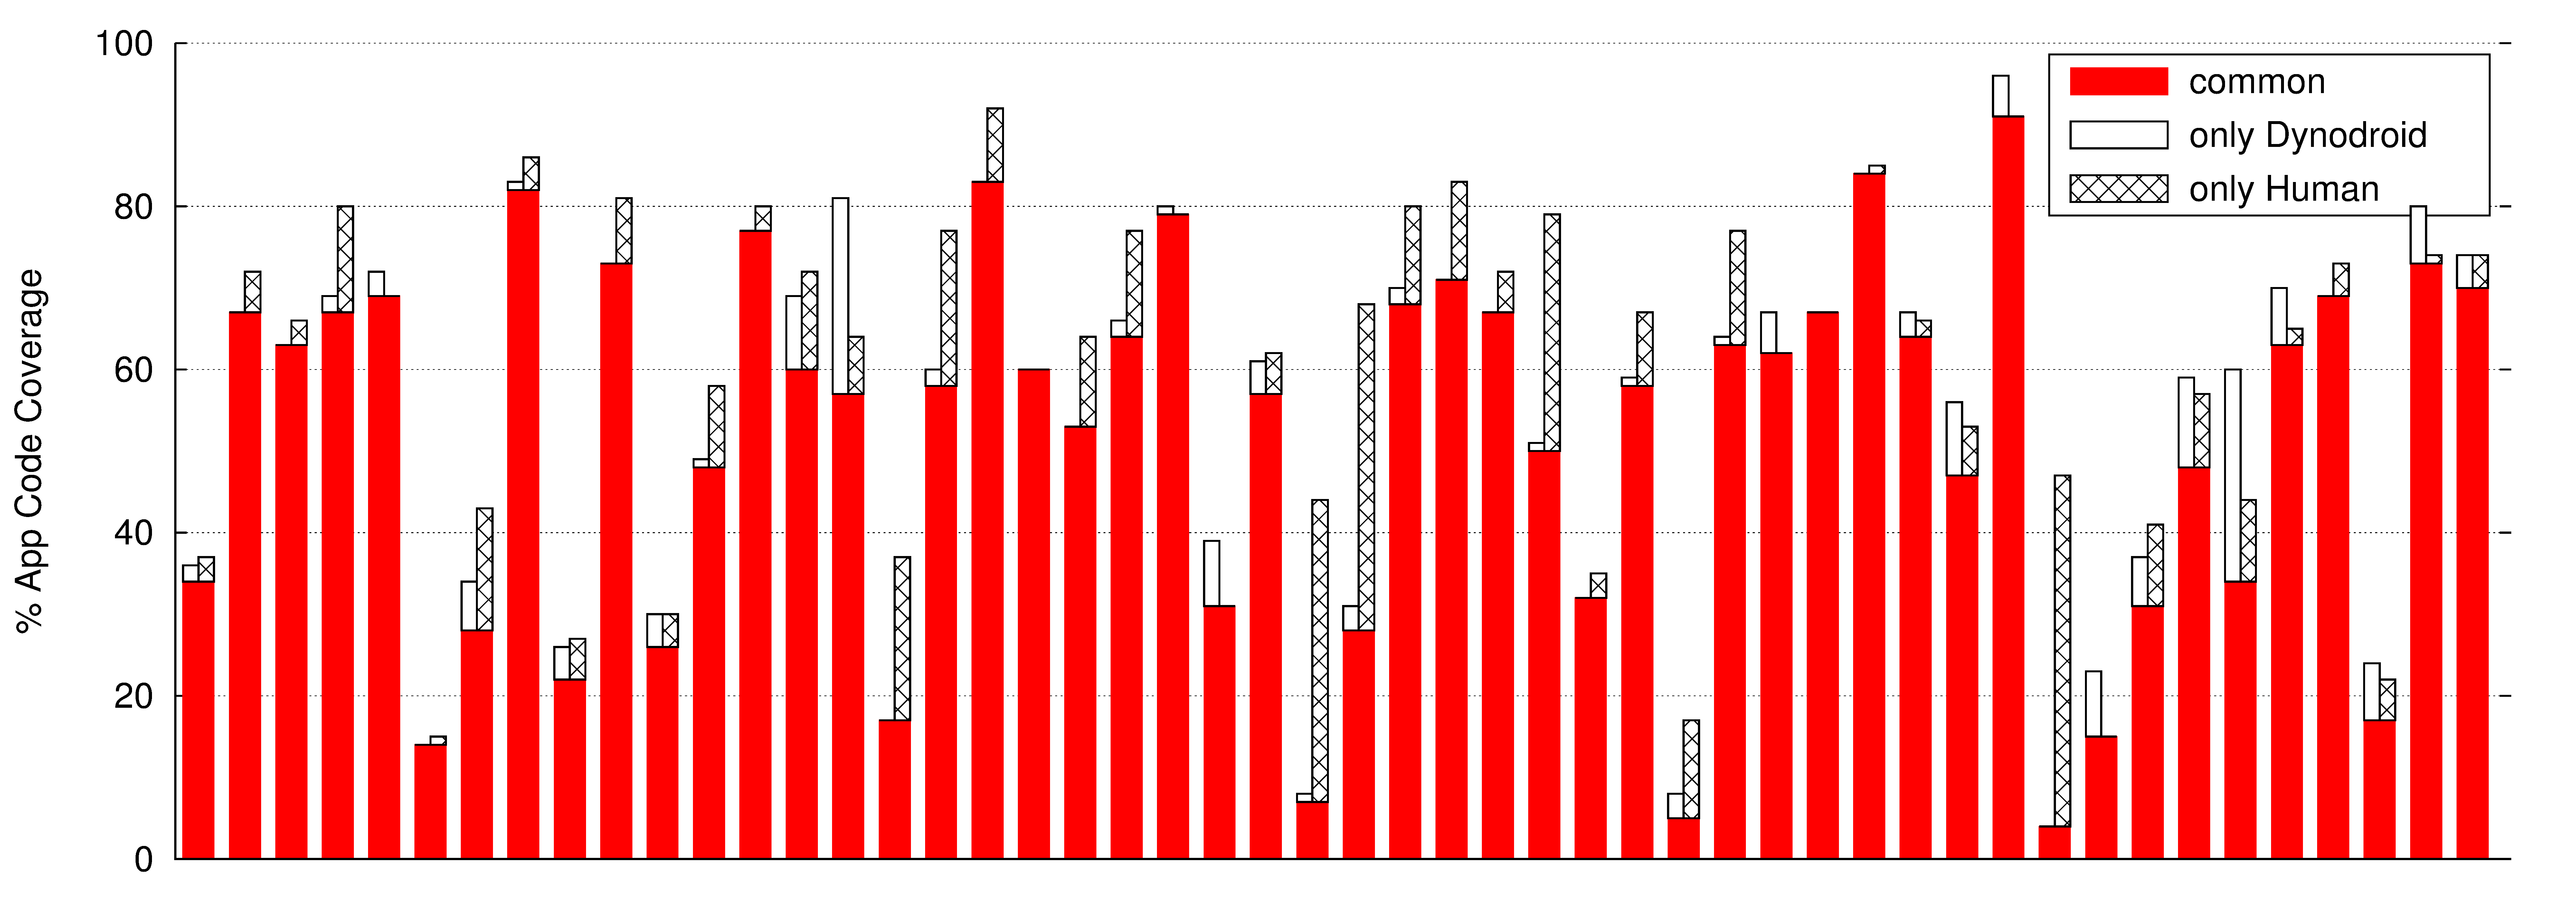
Code Coverage
The results of our code coverage study for the 50 apps are summarized in the two plots below. Each point on the X axis of the below plots denotes the same app.
The below spreadsheet provides detailed data on coverage numbers.
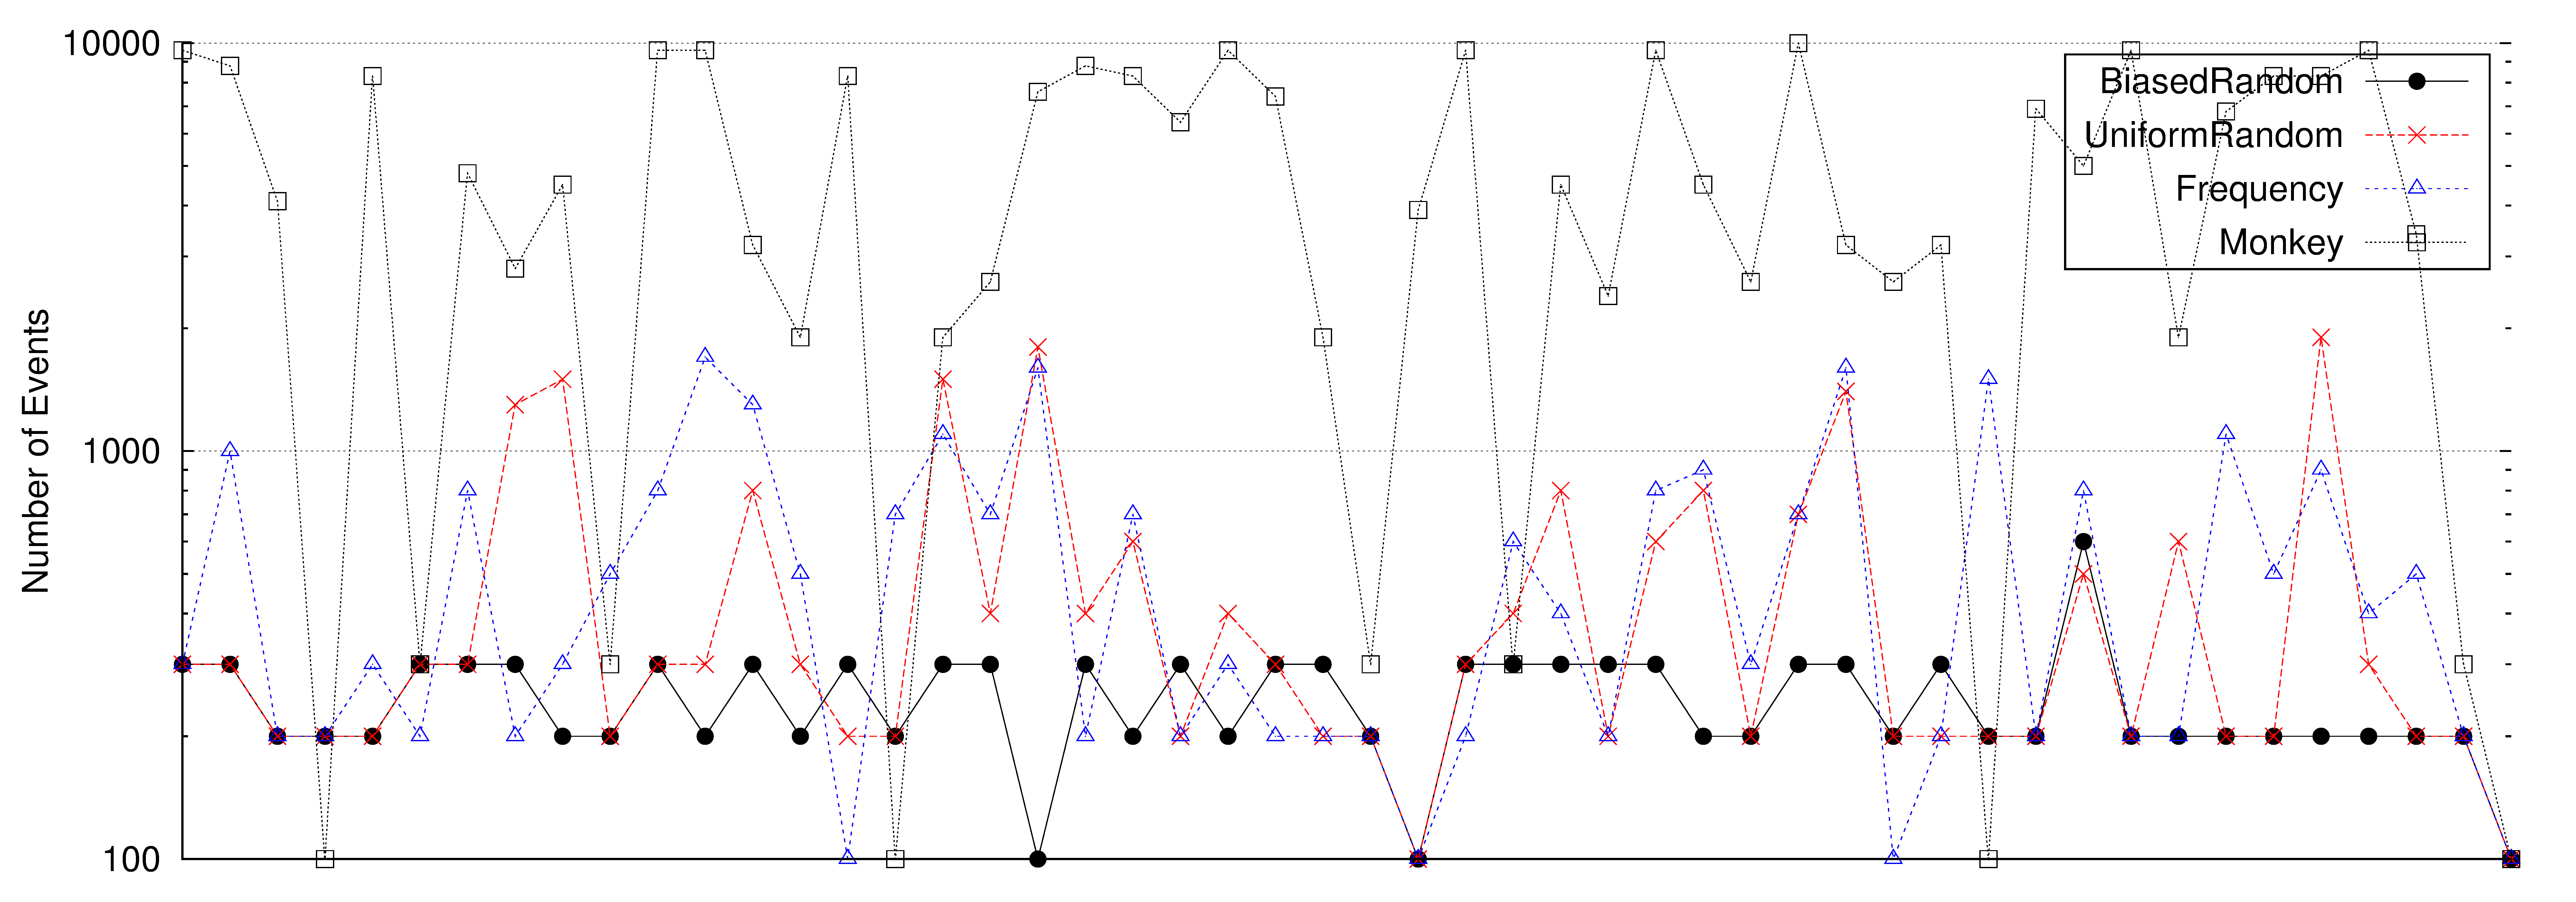
Convergence
The below figure compares the minimum number of events that were needed by each automated approach--Monkey,
and Dynodroid using each of the three selection strategies--to achieve peak code coverage for each of the 50 apps.
The below spreadsheet provides detailed data on convergence trends.